Air quality sensors now integrated to AWEKAS Station’s Web
As we have announced in the last news article, Air quality (abbreviated as “AQ” in the following tesxt) sensors have now been integrated to AWEKAS Station’s Web. A new page within Station’s Web solely for AQ data has been established.
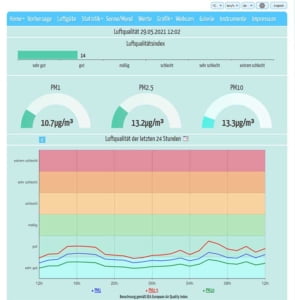 If AQ data is sent to AWEKAS’ servers (and your Station’s web subscription is active), the new AQ page is automatically added to the navigation bar of Station’s Web. On top of the page you can find the automatically calculated Air Quality Index visualised as a bar diagram. Below, PM1, PM2.5 and PM10 particle values are presented seperately in three charts (if present).
Historical data is featured as a line diagram on the bottom of the page. PM1, PM2.5 and PM10 particle values are represented by one line each in front of a color-coded scheme for the Air Quality Index.
All values are calculated in accordance with the Air Quality Index of the European Environment Agency (European Union).